Key points
- This is an analytical exercise, not an assessment of Telangana's health system. It uses open data that may not reflect the current situation on the ground.
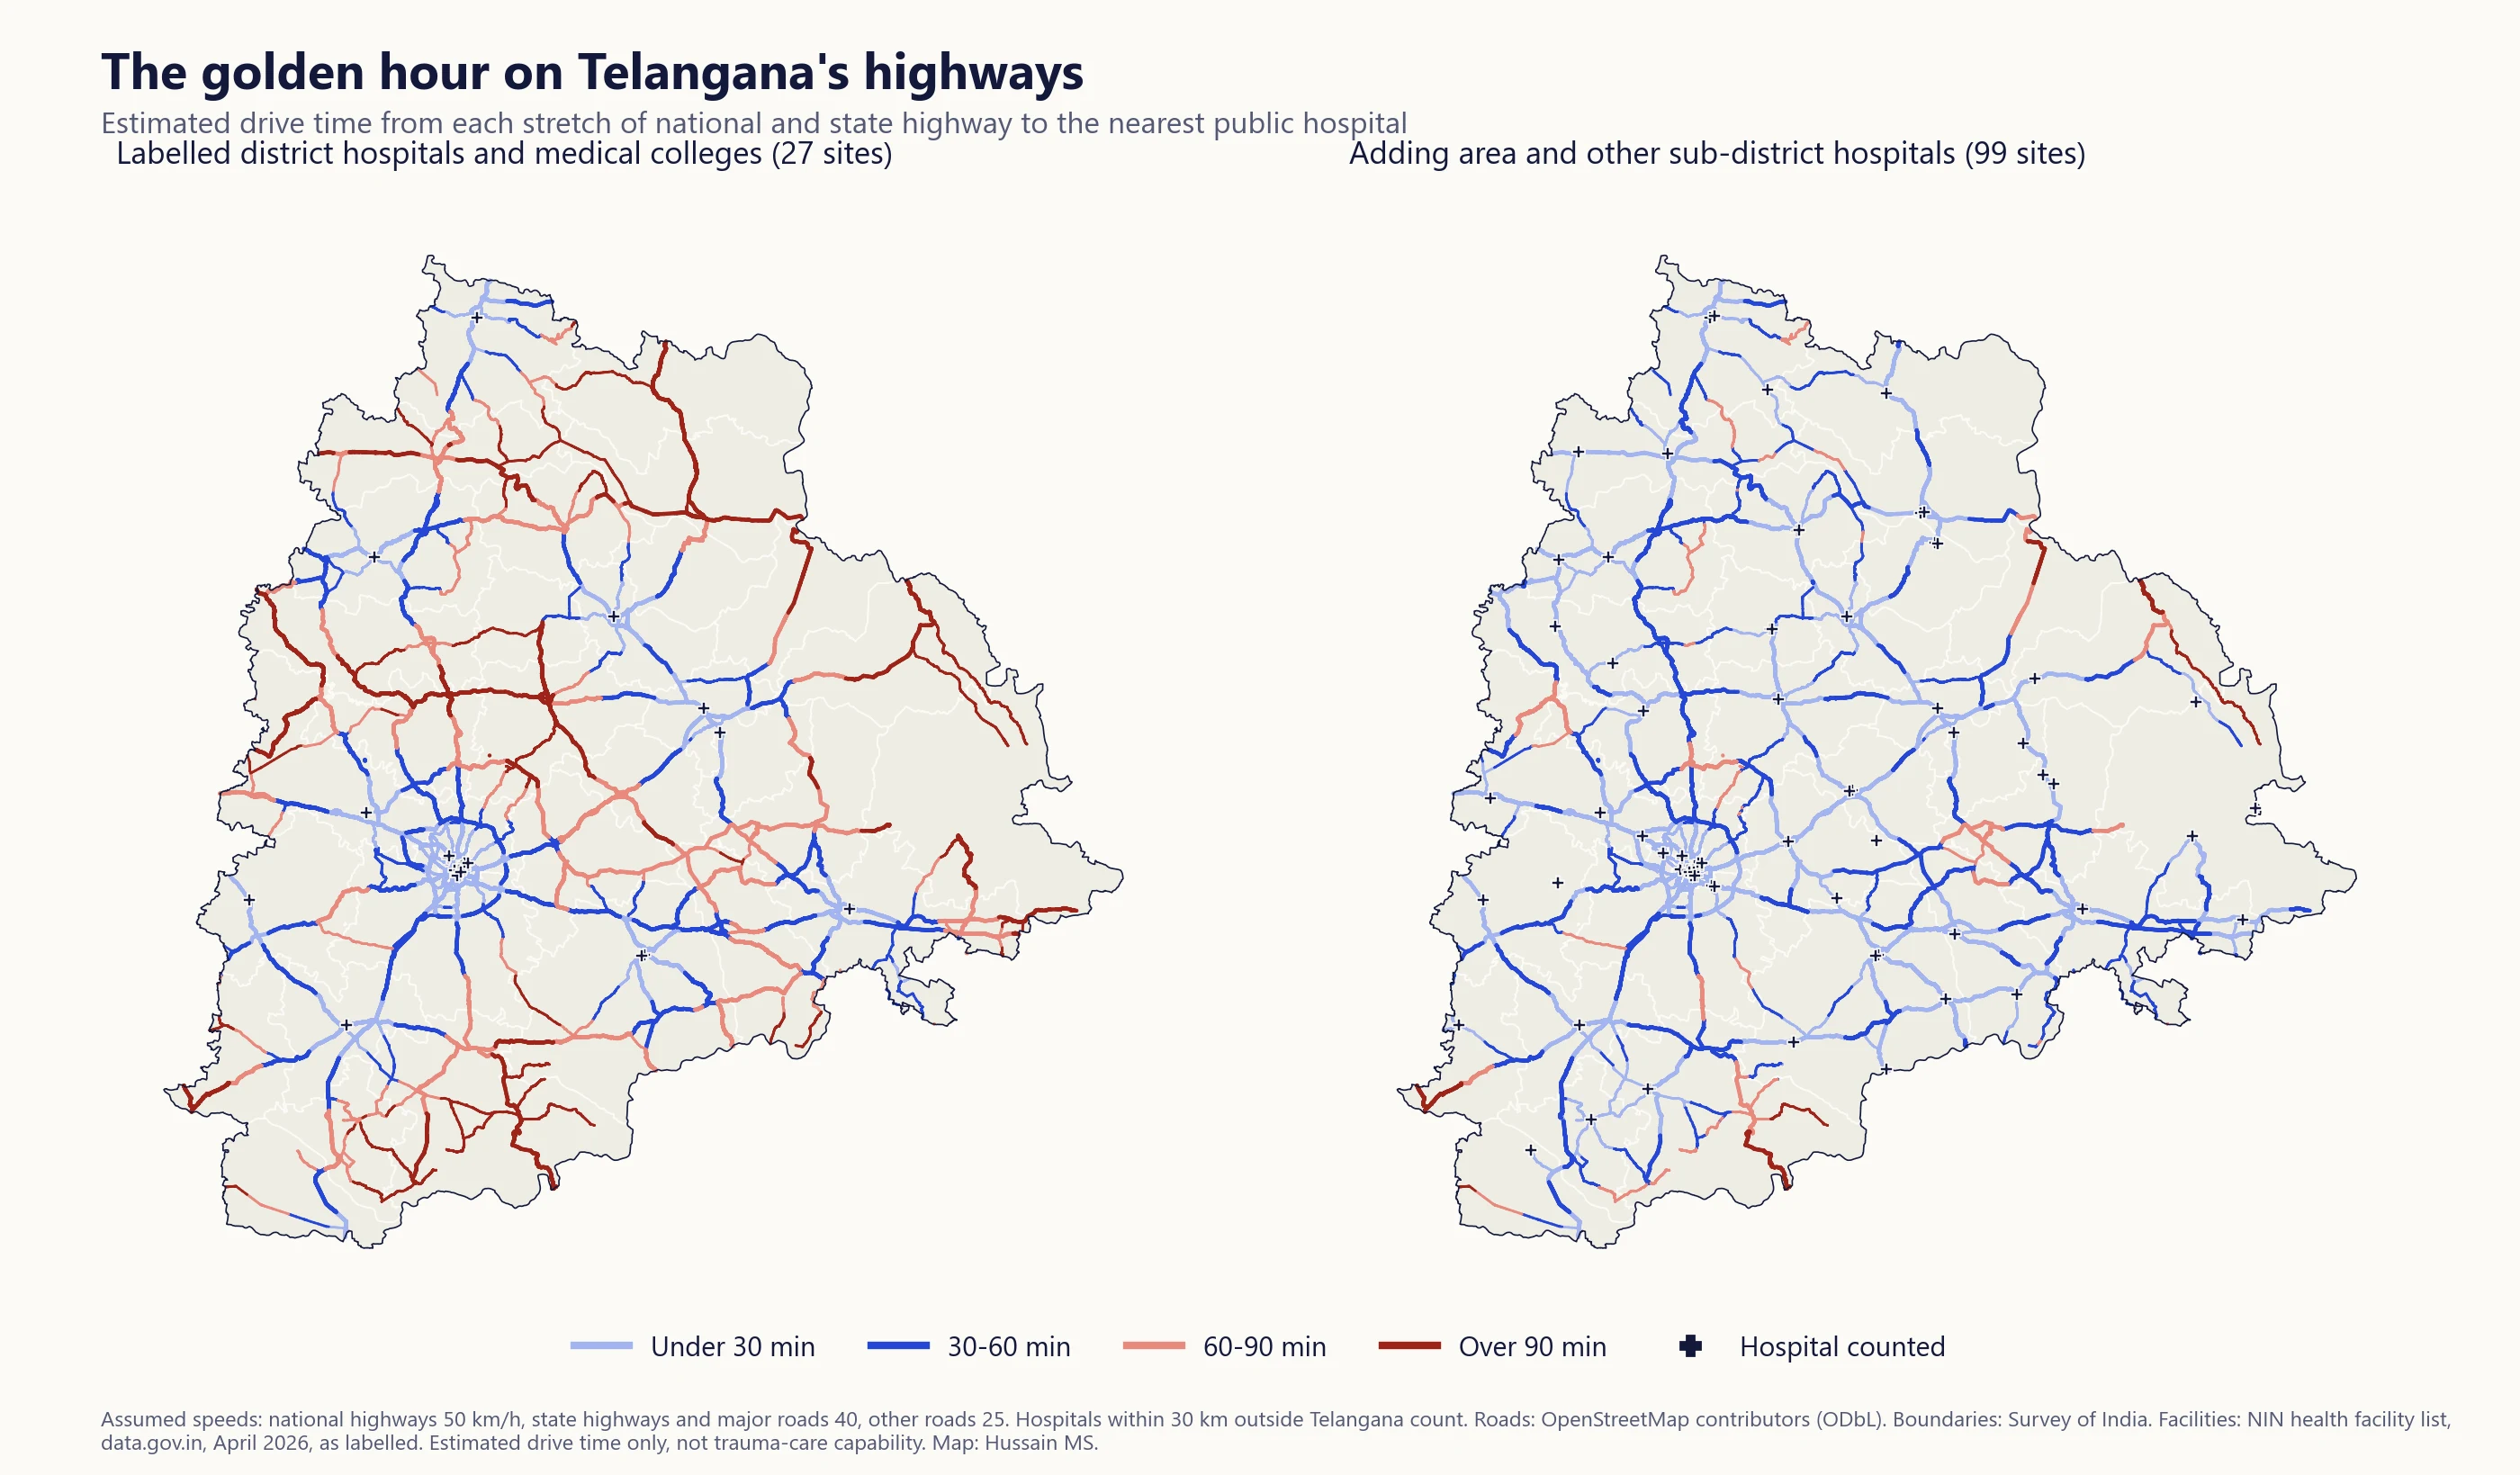
- Under the speeds assumed, about 45% of national highway length is estimated to be more than an hour's drive from a hospital labelled as a district hospital or medical college. When area and other sub-district hospitals are added, the share falls to about 8%.
- The difference shows how strongly the result depends on which facilities are counted and how they are labelled. It says nothing about which hospitals can actually treat serious injuries.
I wanted to try an interesting exercise with open data. If a crash happened on a Telangana highway, how long might the drive to a public hospital be? The answer here is a model, not a measurement. The facility locations come from the National Identification Number (NIN) health facility list published on India’s open government data platform (April 2026), and the roads come from OpenStreetMap. Both are available publicly online, but neither can be assumed to be complete, current or an exact representation of what is on the ground, so this should not be read as a picture of the real system. What it can show is how an analysis like this works, and how much its answer depends on the data behind it.
Road traffic injuries remain a major public health concern in India. Much of what decides whether a seriously injured person survives happens after the crash, including how quickly they reach care that can stop bleeding, secure an airway and operate. This piece looks only at one part of that, the estimated driving time from a point on the road to a listed hospital. It does not include the time to report a crash, dispatch an ambulance or begin treatment, and it does not know whether a hospital can handle trauma.
It is also not a map of where crashes happen. No crash locations were used, so the question is about coverage, meaning which stretches of road would be farthest from a listed hospital.
The golden hour, and why it is only a guide
Trauma care has long used the idea of a “golden hour”, the idea that the sooner a seriously injured person reaches definitive care, the better their chances. The exact sixty minutes is a planning convention rather than a hard biological threshold. Outcomes worsen with delay on a continuum, and the right time differs by injury. As a yardstick for a road network, though, an hour is useful and widely understood, so I use it here.
How I estimated it
I took the road network from OpenStreetMap, the open map built by volunteers, using an extract prepared by the Humanitarian OpenStreetMap Team. The network covers Telangana and extends up to 30 km beyond the state border, so that routes and hospitals just across the border in neighbouring states can be used. All percentages below are calculated only for roads inside Telangana. The whole network, including the border area and all road types, is about 205,000 km long. For the calculation it was broken into small pieces between each pair of mapped points.
Each piece of road gets a travel time from its length and an assumed speed for its class. These are 50 km/h on national highways, 40 km/h on state highways and other major roads, and 25 km/h on everything else. OpenStreetMap does not carry official highway numbers in this extract, so I used its road classes as the closest match (“trunk” roads, mostly national highways, and “primary” roads, mostly state highways). These speeds are assumptions, not measurements.
Each hospital was attached to the nearest point on the road network. The routing ignores one-way rules and access restrictions, so it is a simplification. For every point on the network, the analysis found the quickest route to the nearest listed hospital. A few small road fragments that are not connected to the rest of the network were left out of the percentages.
To see how much the speed assumptions matter, I repeated everything at speeds a quarter slower and a quarter faster. These are sensitivity scenarios. They show the effect of the speed assumption only, not every source of uncertainty in real journeys or in the facility data.
Which hospitals count?
This is where the answer turns. A hospital that can manage serious trauma needs surgeons, anaesthesia, blood and an operating theatre around the clock. The facility list does not record any of that, so I used two ways of counting, based only on the labels in the list.
The first counts facilities labelled district hospital or medical college hospital, which gives 27 sites inside Telangana or within 30 km of it. The second adds facilities labelled area hospital or other sub-district hospital, which gives 99 sites. Neither is a list of hospitals that can treat serious injuries. They are two administrative categories, as recorded in one dataset.
| Estimated share of highway length more than 60 minutes from a listed hospital | National highways | State highways and major roads |
|---|---|---|
| Labelled district hospitals and medical colleges | 45% | 54% |
| Adding area and other sub-district hospitals | 8% | 15% |
These shares are of OpenStreetMap trunk and primary road length, which is not the same as official national and state highway length and counts some divided roads twice, so they are best read as rough proportions.
The speed assumption moves these numbers. Under the first count, between about a third and three fifths of national highway length is beyond the hour across the three speed scenarios. Under the second, it is between 4% and 18%.
What the labels do to the answer
The difference between the two counts is mostly a story about the data. In the list, several district headquarter hospitals appear as area or sub-district hospitals, at least one district hospital appears as a primary health centre, and several of the newer government medical colleges opened in recent years are not labelled as medical colleges at all. A count that relies on the label “district hospital or medical college” will therefore miss hospitals that exist, and the stretches of road it shows as far from care will partly be artefacts of the list.
For that reason I have not ranked districts. A district that looks poorly covered under the first count may simply be one where the local hospital is labelled differently. Any real assessment would start by checking the facility list against what is actually on the ground.
Where could one more site make a difference?
As a modelling exercise, I tested every community health centre and sub-district hospital in Telangana as a hypothetical additional site under the first count. For each one, the measure is the length of major road that is beyond the hour without it and comes within the hour with it added. Under the first count, about 5,300 km of major road is beyond the hour, and the best single candidates each bring roughly 330 to 410 km of it within the hour.
Several of the candidates that score highest are existing area hospitals in district headquarter towns. That fits the pattern above, since some of these may already offer emergency care that the labels do not show. It suggests that reviewing the emergency care readiness of existing facilities could be a useful step before thinking about anything new. The model does not establish what any of these hospitals can do, and it cannot say whether upgrading one would be appropriate or affordable. Facility assessments, staffing and service data, referral patterns and costs would be needed for that. These are candidate locations for further checking, not recommendations.
Why this kind of exercise is useful
The UN’s Decade of Action for Road Safety 2021 to 2030 aims to halve road deaths and injuries by 2030, and the Sustainable Development Goals include a road safety target (SDG 3.6). Prevention, through safer roads, vehicles and speeds, does most of the work. Post-crash care is one of the pillars of the global plan, though, and questions about coverage can be explored with open data. According to the transport ministry’s Road Accidents in India 2023, Telangana recorded 7,660 road deaths that year, of which 3,058 were on national highways (including expressways) and 717 on state highways. Almost half (49%) of the state’s road deaths happened on the two kinds of road this piece maps.
An exercise like this cannot answer the real question on its own. What it can do is show where the questions are, and how much the answers depend on the quality of the data.
Limits
- Open data, not the current system. The facility list and road network may be incomplete or out of date, so results may not match the situation on the ground.
- Labels, not capability. The facility list says where a facility is and how it is labelled, not whether it can handle trauma at any given time.
- Assumed speeds. Real speeds vary by time of day, traffic, road condition and vehicle. The scenarios show the effect of the assumption, not the truth.
- Simplified routing. One-way rules, access restrictions and road closures are not modelled, and hospitals are attached to the nearest road point.
- Driving time only. Time to report a crash, dispatch an ambulance and begin treatment is not included.
- No crash data. This is a coverage map, not a risk map.
Sources
- Facilities: National Identification Number (NIN) health facility list, Open Government Data Platform India (data.gov.in), April 2026, as labelled.
- Roads: OpenStreetMap contributors, extract by the Humanitarian OpenStreetMap Team, Open Database License.
- Boundaries: Survey of India, state and district boundaries.
- World Health Organization. Global status report on road safety 2023.
- United Nations. Global Plan for the Decade of Action for Road Safety 2021–2030.
- Ministry of Road Transport and Highways, Transport Research Wing. Road Accidents in India 2023 (Table 5.6, Annexures 10 and 15).
Code available on request.
Views are my own.