Key points
- A headline score reflects a particular dataset, labelling process, evaluation design and decision rule. Understanding those conditions is part of understanding the result.
- Performance on one dataset does not settle how a model will behave in another population. Prevalence alone can change what a flag means.
- Regulatory requirements, independent benchmarking and local evaluation answer different questions. None substitutes for the others.
Suppose you find a public dataset on maternal health. It has about a thousand rows of tidy numbers covering age, blood pressure, blood sugar, temperature and heart rate for each pregnant woman, and a label saying whether she was low, mid or high risk. You choose a familiar algorithm, train it in an afternoon, and it scores 96% accuracy. It is a satisfying moment. You now have something that looks promising, and it is natural to wonder whether it could one day help a state health programme find high-risk pregnancies earlier.
That result is a real achievement and a reasonable place to start. It is not yet an answer. The useful question at this point is not whether the model is good or bad, but what the 96% actually establishes, and what we would need to know before deciding what the model is useful for.
I did exactly this, and this article follows that one model on its journey, from the score, to what lies underneath it, to whether it would travel to another population, to what changes when someone wants to offer it to a health system. The thread running through it is the difference between a model that performs well on a dataset and a model that is suitable for a real clinical purpose. They are related, but they are not the same thing.
The impressive result
The dataset is the Maternal Health Risk dataset on the UCI Machine Learning Repository, contributed by Marzia Ahmed and colleagues. According to its documentation, it was collected from hospitals, community clinics and maternal health services in rural Bangladesh through an IoT-based risk monitoring system. The downloadable file has 1,014 records (the repository page lists 1,013). Each has six measurements and a risk level.
I asked the question an antenatal care programme would ask. Can we identify the women at high risk? That turns the three labels into two. “High risk” is one group, and “low” and “mid” together are the other. This choice matters later, because a woman labelled mid risk who is flagged counts as a false positive.
The first evaluation was the standard one. I split the records at random, 80% for training and 20% for testing, trained a random forest (a widely used method that combines many decision trees), and measured how it did on the test set. It reached 96% accuracy and 93% sensitivity, meaning it identified 93% of the records labelled high risk in the test set. Repeating the random split twenty times gave accuracies between 91% and 98%, with an average of 94%. As the next section shows, that consistency says less than it seems, because every one of those splits had the same problem.
Looking beneath the score
The first thing a closer look reveals is repetition. Of the 1,014 records, 562 are exact copies of an earlier record, with the same age, the same six readings and the same label. Only 452 are distinct. The dataset does not include patient identifiers, so we cannot say whether these are repeat visits by the same women, repeated readings or an artefact of how the file was assembled. What we can say is that, in my random split, 152 of the 203 test records had an identical record in the training set.
That changes what the test result means. A test set is meant to stand in for new observations. When most of it is identical to what the model learned from, the score tells us a good deal about how well the model reproduces records it has seen, and less about how it would do on records it has not. On the 51 test records with no copy in training, sensitivity was 73%. That figure rests on only 15 high-risk cases, so it is uncertain (a 95% confidence interval of roughly 48% to 89%), but it points in a clear direction.
So I evaluated again in a way designed to estimate performance on unseen records. I kept one copy of each distinct record and used five-fold cross-validation. The data is divided into five parts, and each part takes a turn as the test set while the model is trained on the other four. All preprocessing was fitted inside the training folds only. Some sets of readings still appear more than once with different labels, so I also ran a version that keeps identical readings together in the same fold. It gave slightly better results (AUROC 0.94, sensitivity 75%), so the figures below are the more cautious ones.
| Random forest | Random split, all records | Distinct records, cross-validated |
|---|---|---|
| Accuracy | 96% | 88% |
| Sensitivity (high-risk records identified) | 93% | 70% (95% CI 62–78%) |
| Specificity (other records correctly not flagged) | 97% | 94% |
| AUROC (ability to rank high-risk above others) | 0.96 | 0.92 (95% CI 0.89–0.95) |
A simpler logistic regression model had an AUROC of 0.89 and a sensitivity of 55% on the cross-validated distinct records.
The model still separates the records labelled high risk from the others quite well. An AUROC of 0.92 means that, given one high-risk and one other record, it ranks the high-risk one higher about nine times in ten, and its average precision of 0.83 is well above the 25% share of high-risk records. But at its default setting it now identifies about seven in ten of those records rather than more than nine in ten. Both evaluations are correct calculations. They answer different questions.
How the figures were calculated. All cross-validated figures come from the same out-of-fold predictions at the default 0.5 threshold. Confidence intervals for sensitivity are Wilson intervals on the counts (for example 79 of 112 records labelled high risk). The interval for AUROC comes from 2,000 bootstrap resamples. The random forest’s Brier score was 0.09.
What is the model learning?
A model learns to reproduce the labels it is given. Whether that amounts to learning the clinical concept we care about depends on how the labels were made. The repository describes the risk level as “predicted risk intensity level during pregnancy considering the previous attribute[s]”, which suggests the labels may have been derived from the same measurements the model uses. The labelling process is not documented in detail. I also found 35 combinations of readings that appear in the file with more than one label.
None of this means the labels are wrong. It means we should treat them as the dataset’s definition of risk, not as an established clinical ground truth. Predicting an existing label well is a different achievement from showing that a model can support a clinical decision, such as who needs referral, or who will go on to develop a complication.
The same care applies to unusual values. Ages in the file range from 10 to 70, and 134 records fall below 13 or above 50. Two records show a heart rate of 7 beats per minute, which is almost certainly a recording error. Some of the ages may be real. Without the people who collected the data, we cannot tell.
Errors are not all alike
Accuracy treats every mistake the same. In antenatal care they are not the same. Missing a woman who needs extra attention (a false negative) has different consequences from flagging a woman who turns out not to meet the high-risk definition (a false positive). This is why it helps to separate three properties that are often blended together.
- Discrimination is how well the model separates or ranks women with and without the outcome. AUROC measures this.
- Calibration is whether its probabilities mean what they say. If the model gives a group of women a 30% risk, about 30% of them should be high risk. In this small dataset the random forest’s probabilities were reasonably close to the observed shares, though the estimates are imprecise. The logistic model was less well calibrated in the middle range. Among the 53 women it scored at 20–40%, about half were high risk.
- The threshold is the cut-off at which a score becomes a flag, and so triggers an action. Most software uses 0.5 by default. That is a convention, not a clinical decision.
Moving the threshold shows the trade-off directly. Lowering the logistic model’s threshold from 0.5 to 0.2 raised sensitivity from 55% to 85%, while the share of women flagged rose from 18% to 34%. Whether that is an improvement depends entirely on what a flag sets in motion, and whether the health system can respond to a third of all pregnancies being flagged.
Who does it work for?
An overall figure can hide differences between groups. When I broke results down by age, the random forest identified 45% of the records labelled high risk among women under 20 (10 of 22), compared with about three-quarters in older groups. That is worth noticing, because adolescent pregnancy carries its own risks. It is a signal for further evaluation, not evidence of a general difference, and it needs care. There were only 22 high-risk records among women under 20, so the estimate is unstable, and the 95% confidence interval runs from about 27% to 65%. In this dataset, high-risk records from younger women also had quite different readings, with an average systolic blood pressure of about 96 mmHg compared with 122–128 mmHg in older groups. That may be part of the explanation, but this analysis cannot establish why the difference occurs, and it says nothing about how the model would perform for adolescents anywhere else.
By this point the 96% has not been disproved. It has been placed in context. It is the product of a particular dataset, a particular labelling process, a particular evaluation design and a particular decision rule.
From one dataset to another population
Suppose the more careful evaluation had come out well. That would tell us about performance on unseen records from the same source. It would not settle how the model would behave somewhere else. A model developed on data from rural Bangladesh cannot simply be assumed to perform the same way in an Indian state. Care-seeking, clinical practice, measurement devices, data quality, referral pathways and how common high-risk pregnancy is may all differ, and the relationships the model learned may shift with them.
Two related ideas help here. Transportability is whether performance carries over to a different population, setting or workflow. Local validation is evidence that the model performs adequately where it is actually meant to be used. Neither implies that every model must be rebuilt for every district. Both imply that this is something to investigate, not presume.
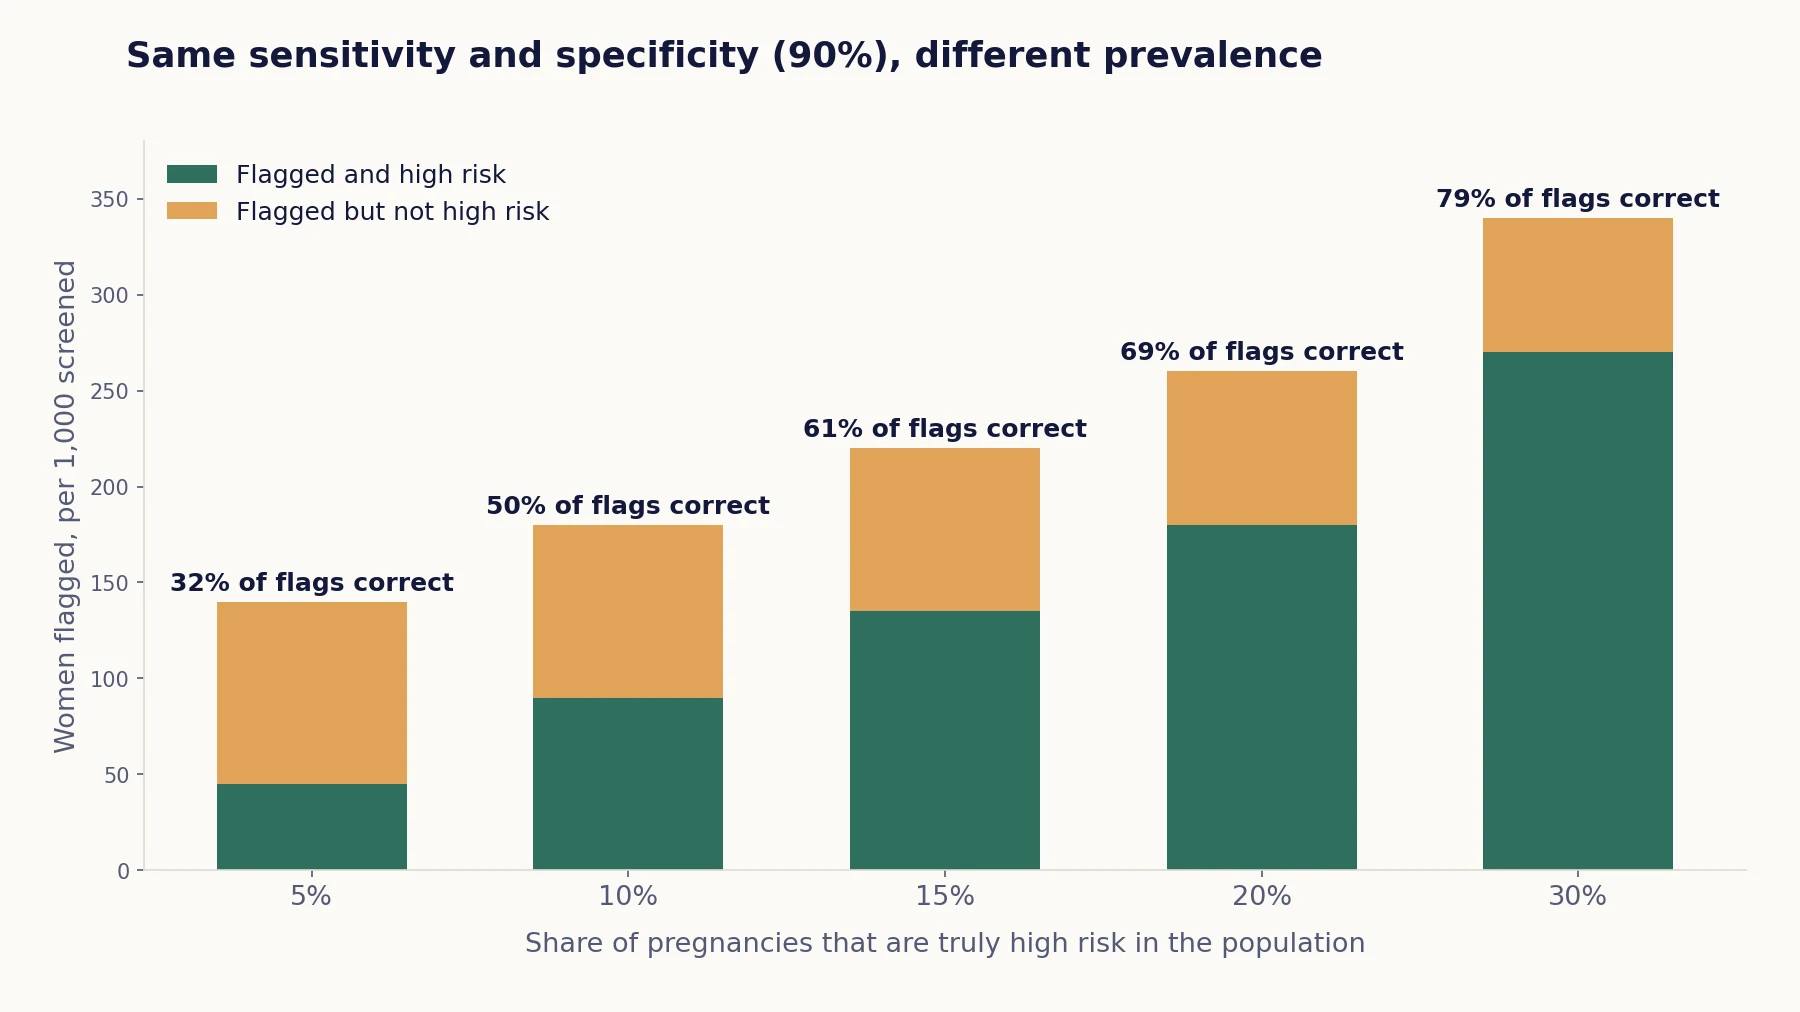
Prevalence, meaning how common the outcome is, is a simple way to see why. Suppose, purely for illustration, that a model has 90% sensitivity and 90% specificity, and that these stay constant across settings. (In practice they often change too.) Here is what happens in 1,000 pregnancies.
| Share of pregnancies that are high risk | Correctly flagged | Flagged but not high risk | Share of flags that are correct |
|---|---|---|---|
| 5% | 45 | 95 | 32% |
| 15% | 135 | 85 | 61% |
| 30% | 270 | 70 | 79% |
The model has not changed, but what a flag means has. A tool developed where three in ten women seen are high risk, such as a referral hospital, will find that most of its flags are confirmed. Used in a community setting where high risk is less common, most of its flags will not meet the definition.
Scale makes the implications concrete. In an illustrative district with 40,000 registered pregnancies a year, 15% of them high risk, the same model would flag about 8,800 women. Around 3,400 of them would not meet the high-risk definition, and about 600 high-risk women would not be flagged. If sensitivity were 70% rather than 90%, the number not flagged would rise to about 1,800. These are not forecasts for any real district. They show how a performance figure turns into workload and consequence. And a woman counted as a false positive is not necessarily a woman without health needs. She simply does not meet the particular outcome definition used in the analysis.
That leads to the practical question underneath all the statistics. What would the model’s output actually do? Would a flag trigger a further assessment, a referral, closer monitoring or a change in management? And what happens to a woman who is not flagged?
From prediction to a health product
Answering that question means placing the model beside the way the task is done today. Many programmes already have established ways of identifying high-risk pregnancies, such as a protocol, a checklist of danger signs, a register, and the judgement of the ANM and the medical officer. The comparison that matters is usually not between an AI model and nothing. It is between care with the model and care as it already is.
I have seen how much the existing approach can achieve on its own. In a maternal health programme I worked on, the share of pregnancies identified as high risk rose from a very low level to one much closer to planning expectations, without any model, alongside training for ASHAs and ANMs, a simple tool listing high-risk signs, and a register they were comfortable using. These are identification rates, not health outcomes, but they show how much the existing approach can change what a health system sees. Against a baseline like that, the questions become sharper. Does the model find women the existing approach misses? Does it help prioritise, or make assessment more consistent or timely? Does it reduce work, or add alerts that someone must follow up? Does it give frontline staff something new, or repeat what they already know?
Now imagine the developer is satisfied with the analysis and wants to take the model beyond a notebook, perhaps offering it to a state health department. The questions change again. We are no longer asking only whether the model predicts a label. We are asking what the product is for, what is being claimed for it, and where it will be used.
In India, the Central Drugs Standard Control Organisation (CDSCO) has published a Guidance Document on Medical Device Software (CDSCO/MD/GD/MDSW/01/2026). It states that any software intended by the manufacturer for medical purposes, which attracts the definition of a medical device under the Drugs and Cosmetics Act, 1940 and the Medical Devices Rules, 2017, is regulated as a medical device. The guidance says it reflects current practices under the 2017 Rules and should not be misconstrued as a new regulatory control, and its notice advises readers to refer to the statutory provisions for professional needs. It is still a useful window into how a regulator thinks. It asks that the intended use statement be clinically meaningful and define the software’s clinical role, for example whether it is decision support software or provides a definitive diagnosis or treatment recommendation, along with the intended disease or condition, patient population and users. For AI-based software, it asks the applicant to disclose the composition of the datasets used for training, validation and testing, “including demographic distribution, geographic origin, and clinical diversity”, and to provide evidence on “model bias, generalizability, and robustness across sub-populations relevant to India.” One line speaks directly to our example. “Where models are trained or validated in non-Indian settings, justification shall be provided for applicability to Indian clinical environments.” For changes over time, it describes an Algorithm Change Protocol that may be devised, wherever applicable, so that changes to the software do not compromise its safety and intended use.
The guidance makes the intended use, as stated by the manufacturer, fundamental to how software is classified by risk. So the same model could raise very different questions depending on what it is claimed to do. As I read it, a promising model or a working demonstration is only the start. Turning a model into a health product brings its own set of questions.
From authorisation to adoption
Even where regulatory authorisation is required and granted, it answers a different question from whether a product will work well in a particular state or programme. A product can meet its regulatory requirements and still need evaluation before adoption, covering how it performs with that population, how it fits into existing care, what staff need to do with its outputs, and what happens when it is wrong. There are practical questions too, such as integration with existing information systems, data quality, connectivity, training, referral capacity, maintenance, cost, and who is responsible for acting on each alert. A technically sound product can struggle if it does not fit the circumstances in which people are expected to use it. None of this is a failure of regulation. Regulation and implementation are connected, but they are different jobs.
This is where India’s newer health AI initiatives become relevant. According to the Press Information Bureau, the Ministry of Health and Family Welfare released the Strategy for AI in Healthcare for India (SAHI) during the India AI Impact Summit 2026 in New Delhi. The PIB describes SAHI as setting out “a national framework to guide the responsible integration of AI into India’s health system”, and as working as “a recommendatory national framework”. BODH (Benchmarking Open Data Platform for Health AI), also launched at the Summit, was developed by the Indian Institute of Technology Kanpur in collaboration with the National Health Authority. The PIB describes it as providing “a structured mechanism for testing and validating Health AI solutions before deployment at scale.”
Going by those descriptions, the two do different things. SAHI guides how AI should be adopted, and BODH tests and validates solutions. It is worth being clear, in general terms, about what any benchmark can show. A benchmark result is evidence about performance under defined evaluation conditions. It is not, on its own, proof of clinical safety in every setting or proof that patient outcomes will improve. What structured testing offers is a step beyond relying on a developer’s own reported score. For our model, that would have been precisely the kind of test it had not yet faced.
What evidence would be enough?
Bringing these threads together, what would it take to show that a model like this is useful for its intended purpose? Depending on what it is meant to do and its stage of development, the evidence might include an evaluation on genuinely unseen data, measures of discrimination and calibration, results for relevant subgroups with their uncertainty, validation in the intended population, and a comparison with existing practice. If the model is meant to influence clinical decisions, an early-stage clinical evaluation would show how health workers interact with it, how it changes their decisions, and what unintended effects appear.
The right level of evidence depends on the intended use and on the consequences of being wrong. A model that helps prioritise administrative follow-up does not raise exactly the same questions as one that informs a diagnosis or treatment decision.
There is good guidance for each stage, and each has a different purpose. TRIPOD+AI (BMJ, 2024) sets out what studies of prediction models built with regression or machine learning should report. DECIDE-AI (Nature Medicine, 2022) covers the early clinical evaluation of AI decision-support systems in real use. WHO’s Regulatory considerations on artificial intelligence for health (2023) outlines key regulatory considerations, intended to help governments and regulators develop or adapt their own guidance. None is a checklist that certifies a model as ready. Together, they describe the kinds of questions responsible development raises.
After introduction
The journey does not end when a model is authorised, evaluated or introduced into a programme. Populations change, data collection practices evolve, protocols are revised, and a health system’s capacity to respond to alerts can grow or shrink. Performance measured at the start may not hold.
That raises further questions. Who monitors performance once the model is in use, and how often? How are updates assessed before they reach health workers? Who investigates when something looks wrong? What happens if the model no longer performs adequately, or if the vendor stops supporting it, or the programme decides to stop using it? A health AI product is not a model trained once and left alone. Its usefulness depends partly on the conditions in which it keeps operating.
Back to the 96%
Return to the model we started with. Its 96% was a fair result for the question it answered, which was how well it reproduced labels in a random split of a dataset with many repeated records. A more careful evaluation gave a more modest and more informative picture. The model ranks the dataset’s high-risk label well, identifies about seven in ten of those records at its default setting, may do less well for younger women in this dataset, and has never been tested outside the source it was built from.
So would I deploy it? Not on this evidence. That is not because the model is poor, but because the evidence we have answers a different question from the one deployment asks. None of that is a reason to abandon models like it. A high score is a good reason to investigate further. Careful evaluation tells us what the score means. Evidence from other populations, clinical context, regulatory review, independent benchmarking and implementation experience each answer a different question, and none should be mistaken for another.
The question worth asking, then, is not simply whether a model works. It is what it works for, for whom, under what conditions, compared with what we already do, and with what consequences when it is wrong.
Further reading
- Ahmed, M. (2020). Maternal Health Risk [Dataset]. UCI Machine Learning Repository. https://doi.org/10.24432/C5DP5D (CC BY 4.0)
- Collins G.S. et al. TRIPOD+AI statement: updated guidance for reporting clinical prediction models that use regression or machine learning methods. BMJ 2024;385:e078378.
- Vasey B. et al. Reporting guideline for the early-stage clinical evaluation of decision support systems driven by artificial intelligence: DECIDE-AI. Nature Medicine 2022;28:924–933.
- World Health Organization. Regulatory considerations on artificial intelligence for health. Geneva, 2023.
- Central Drugs Standard Control Organisation. Guidance Document on Medical Device Software (CDSCO/MD/GD/MDSW/01/2026). https://www.cdsco.gov.in/opencms/export/sites/CDSCO_WEB/Pdf-documents/Guidance-document-on-Medical-Device-Software-under-MDR-2017.pdf
- Press Information Bureau. Background note on AI in healthcare, SAHI and BODH (India AI Impact Summit 2026). https://static.pib.gov.in/WriteReadData/specificdocs/documents/2026/mar/doc202635810601.pdf
- Code and full results: available on request
This is an illustrative analysis of one public dataset, not a clinical validation study. It cannot show how the model would perform in Indian health systems or whether using it would improve maternal outcomes. Views are my own.