Key points
- Cities pack very different lives into small areas, so averages hide the people most at risk. India's National Urban Health Mission (NUHM) asks cities to map vulnerability before planning services.
- The 2017 national guideline sets out city mapping, then group discussions at ward and slum level, then a household survey that ASHAs can score from 0 to 42.
- GIS can support the geographic parts of this work. It does not replace the field visits, the discussions or the judgement of the people doing them.
Cities are dense, and they are uneven. Within a single ward, an apartment block and a settlement along a railway line can sit a few hundred metres apart and have almost nothing in common in their health. City averages hide this. India’s urban health mission starts from that observation. Before a city can plan outreach, place a clinic or budget for medicines, it has to know where its most vulnerable people live.
What the guideline asks cities to do
The Ministry of Health and Family Welfare’s Guidelines and Tools for Vulnerability Mapping & Assessment for Urban Health (2017) describes vulnerability mapping and assessment as “the process by which the location, access to basic amenities and the susceptibility of the urban poor towards illness can be understood.” In practice the work moves from the city as a whole down to individual households.
1. City mapping. The first step is a map of the city showing what matters for urban health. The guideline lists the location of all health facilities, public and private, and their catchment areas, slums with their population, anganwadi centres, schools, municipal and ward boundaries, major roads, landmarks and water bodies. It recommends GIS, but it also allows a city to take an existing map and update it by hand, zone by zone, through discussions with local informants and field visits.
2. Ward and slum level assessment. Teams are formed for each zone, ward or urban primary health centre area, drawing on ASHAs, ANMs, the public health manager and local members. A ward level discussion with officials and local representatives uses the ward tool in Annexure B to build a profile of the ward, including its population, how many listed and unlisted slums it has, migrants and homeless people, health facilities, schools, anganwadis and frontline workers. The teams then hold group discussions in each slum and vulnerable pocket, using the tool in Annexure A. The guideline suggests 8 to 15 people per discussion, and separate discussions with groups such as ragpickers, the elderly, domestic and construction workers, homeless people and street children. Findings are collated into ward reports and then a city vulnerability report.
3. Household assessment. Finally, households are surveyed using the tool for ASHAs in Annexure C. The guideline recommends covering the whole urban population where possible, with priority for the urban poor, and suggests combining the survey with the family registration the urban primary health centre does anyway.
These steps follow a logical order, from city to ward to slum to household. The guideline is clear that they need not wait for each other. Group discussions and the household survey can run at the same time once a usable map exists.
Three kinds of vulnerability
The guideline defines three overlapping criteria. In its words:
- Residential or habitat based vulnerability covers people who are vulnerable to ill health “because of their residential location and type of housing”. This includes homeless and mobile populations, people in kutcha or temporary housing without secure tenure or basic services, and those living near hazardous industries, along railway tracks, under flyovers or in areas prone to floods and landslides.
- Social vulnerability is faced by people “discriminated based on their social status”, whether by caste, class, ethnicity, religion, gender, age, disability or illness.
- Occupational vulnerability is faced by people without regular employment or working in unsafe conditions, such as rag pickers, head loaders, construction workers, domestic workers and street vendors.
The residential criteria will look familiar to anyone who knows UN-Habitat’s definition of a slum household, which also rests on water, sanitation, durable housing, living space and security of tenure. The NUHM criteria go further, adding social and occupational vulnerability that a housing survey would miss.
A score an ASHA can calculate
The household tool has 21 questions in four sections. They cover residential conditions such as slum status, housing, toilets, water, drainage and electricity, social factors such as family type, documents and disability, occupation and working conditions, and health, such as distance to a facility and where the family seeks care. Each answer scores 0, 1 or 2, with 0 the most vulnerable. The total runs from 0 to 42, and the guideline bands it as 0 to 15 “most vulnerable”, 16 to 30 “highly vulnerable” and 31 to 42 “vulnerable”.
The tool is deliberately simple. It needs no software, and its categories are ones a community health worker can judge on a household visit. Its value comes from adding up. Once households are scored, settlements, wards and the city can be compared.
Where GIS can help
GIS is most useful in the geographic parts of this process. It can bring ward boundaries, facilities, roads and settlements onto one base map, which is the core of city mapping. It can help divide a city into zones for the field teams. It can show where settlements sit in relation to health facilities. And once assessments are done, it can show the results in a form that a city health officer, a councillor and a municipal engineer can read together, which matters because many of the fixes, such as drains, water and housing, sit outside the health department.
What GIS cannot do is the assessment itself. The discussions in each settlement, the household visits and the local knowledge of ASHAs and ward teams are what the guideline relies on. A map organises that work. It does not replace it.
The three maps below show how these techniques could be used, with Chennai as the example. I put them together from publicly available sources, which may be dated and may not exactly represent the city’s wards and facilities today. The vulnerability categories in the second map are hypothetical. The maps are meant to show what the techniques can do, not to serve as guidance or as an assessment of Chennai.
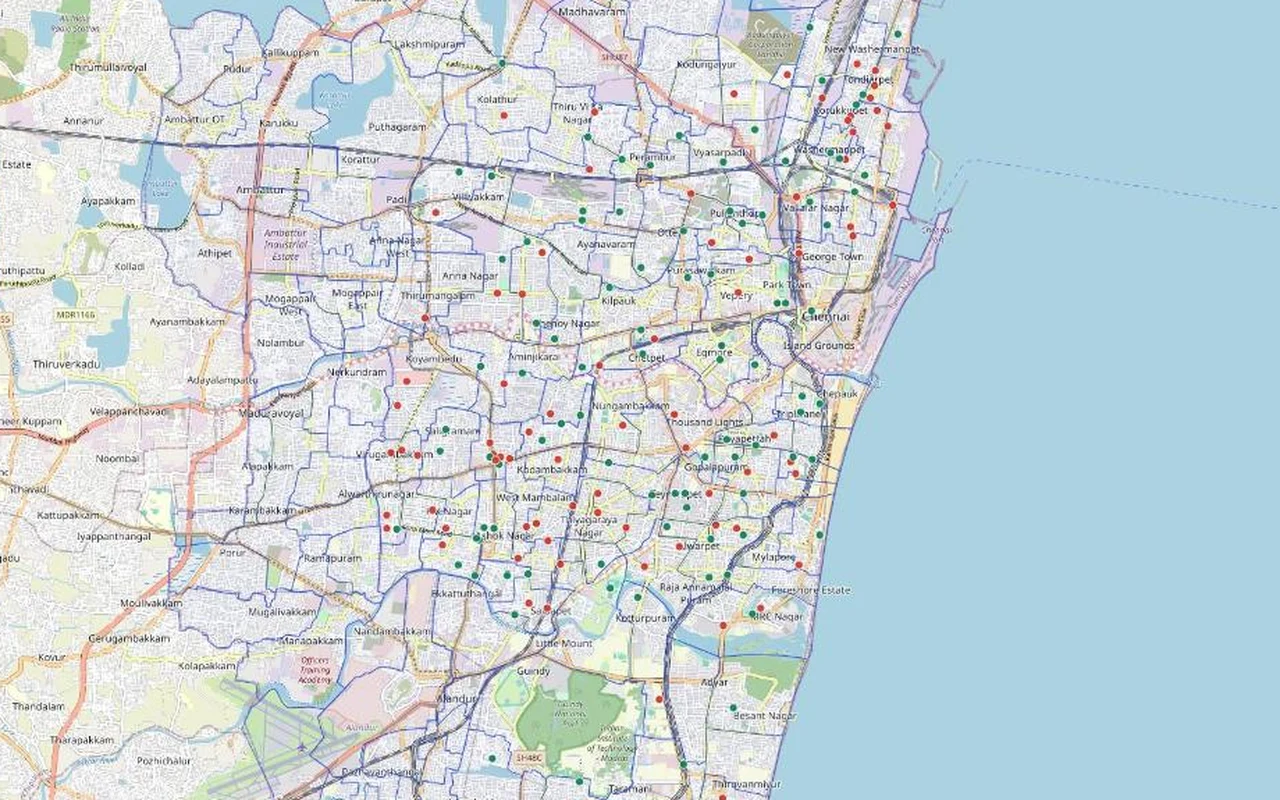
Map 1. Wards and health facilities
This is the base layer that city mapping asks for, and it already shows why the guideline puts it first. The facilities in this list cluster in the older central city. The outer areas, much of which joined Chennai when the city expanded in 2011, have very few entries. Before any of these points is used for planning, the list would need to be checked and completed on the ground.
Map 2. Showing categories on city blocks
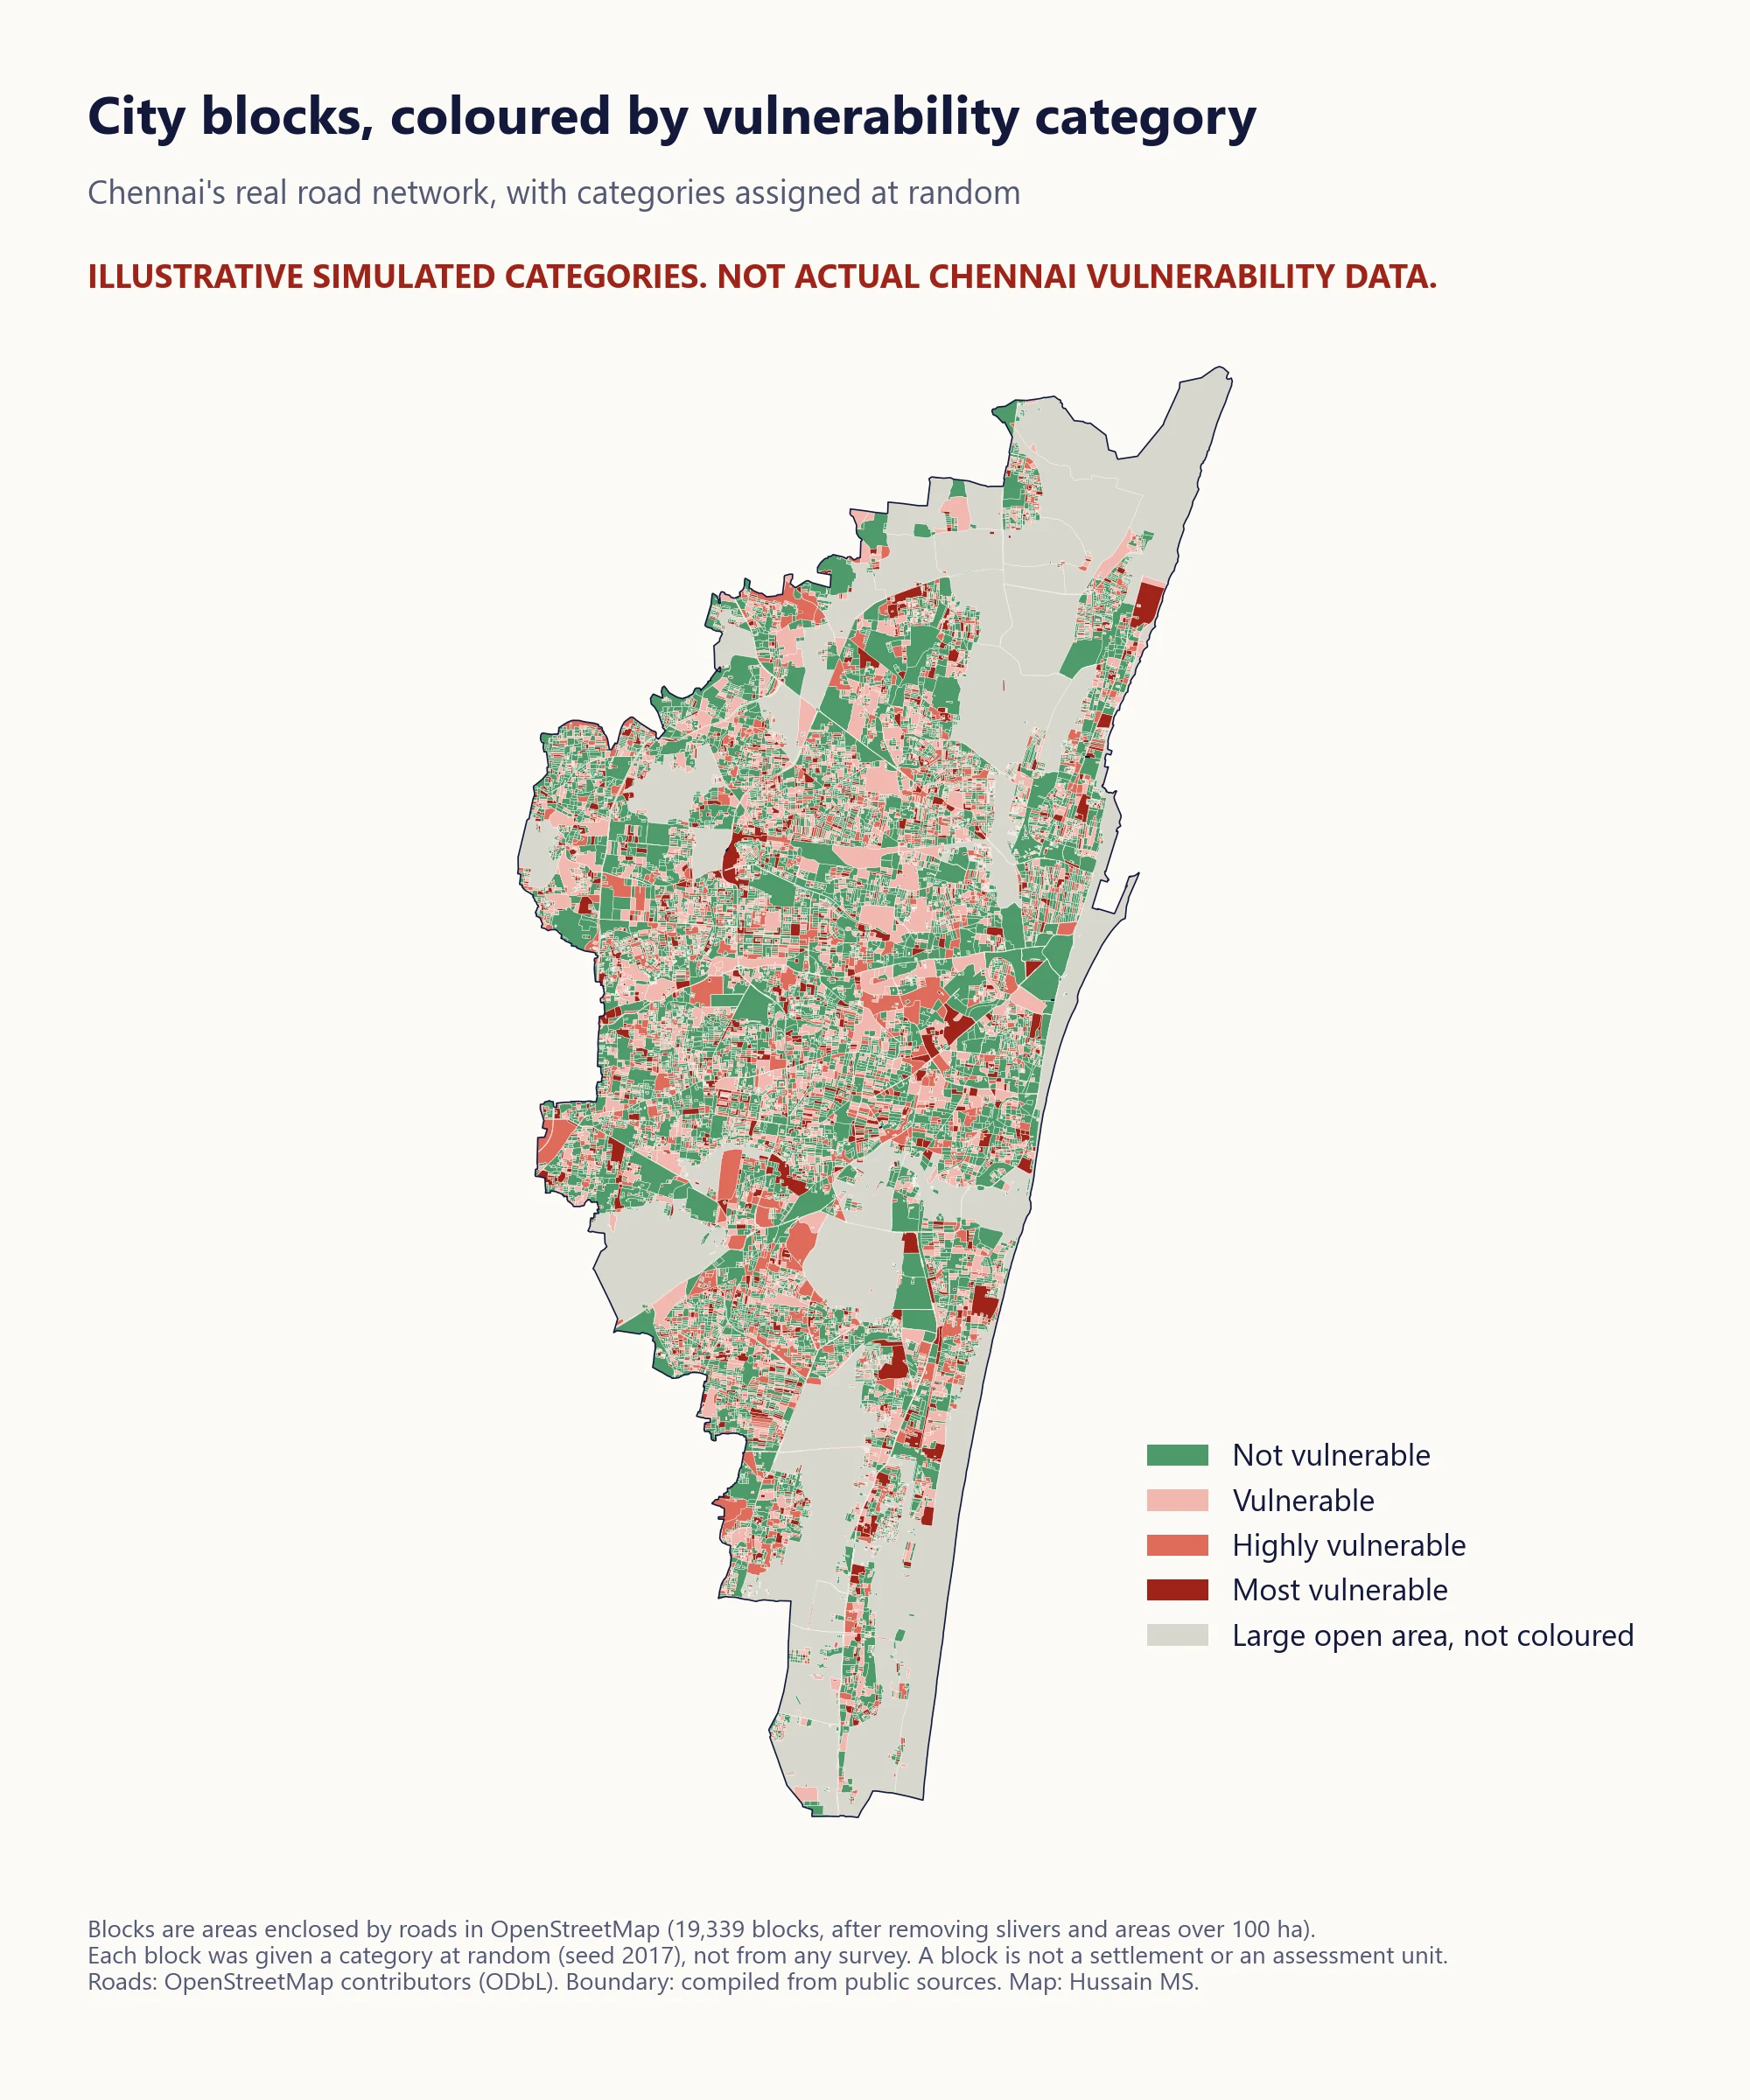 Illustrative only. The blocks are areas enclosed by roads in OpenStreetMap, and each was given a hypothetical category at random. The colours do not describe vulnerability anywhere.
Once assessments exist, the results need a way to be seen. This map shows one technique. The road network is turned into blocks, the small areas enclosed by roads, and each block is coloured by a category. Here the categories are assigned at random with a recorded seed, so the pattern means nothing. Green stands for areas outside the vulnerable categories, and the three shades of red follow the guideline’s three bands. Very large open areas, such as the beach, marshland and large parks, are left uncoloured. A block is not a settlement or an assessment unit. In practice, the colours would come from the ward and household assessments, joined to the settlements they describe.
Map 3. Distance to the nearest listed facility
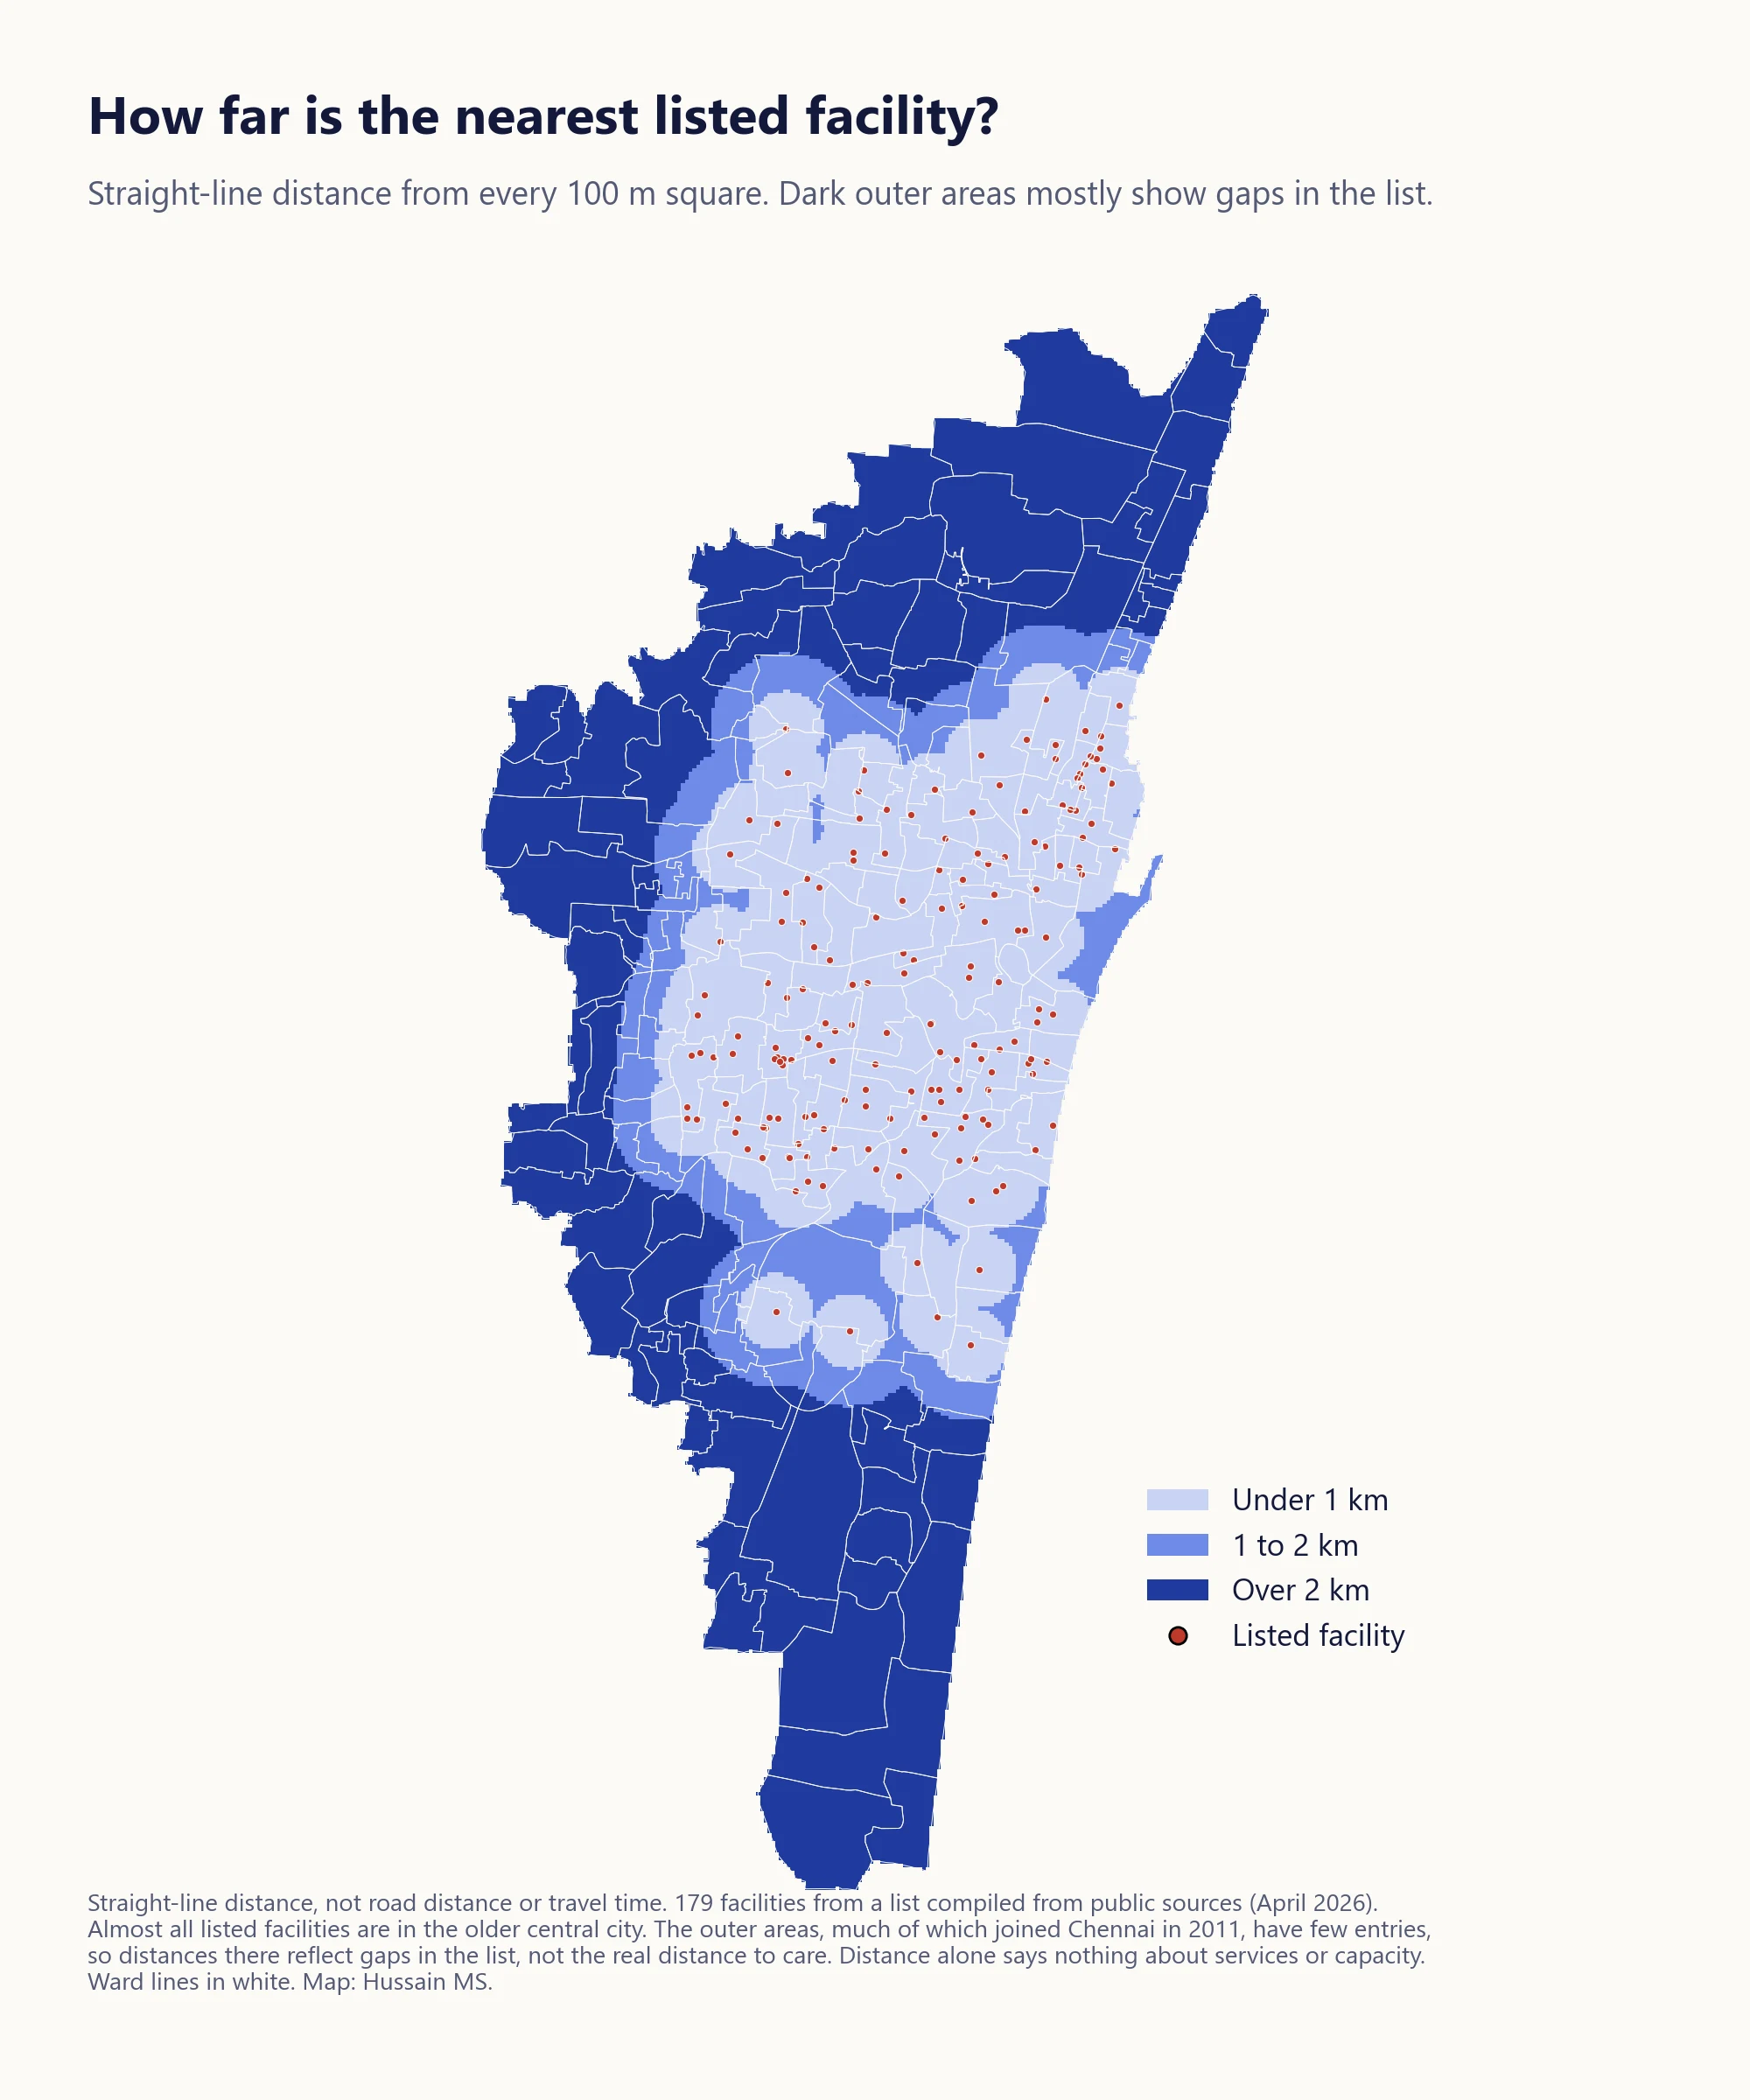 Straight-line distance from every 100 metre square to the nearest facility in the list. The dark outer areas mostly reflect gaps in the list rather than how far people are from care.
One question in the household tool, distance to a health facility, can be estimated from a map. This map measures straight-line distance, not distance along roads or travel time, and uses the same bands as the tool, under 1 km, 1 to 2 km and over 2 km. It shows the limits of the facility list as much as distance. Because the list is thin outside the older city, the outer areas look far from care when they may not be. Distance alone also says nothing about the services a facility offers, its capacity or whether people can use it.
What this shows
Mapping is a support to the process the guideline describes, not a substitute for it. The maps here show how GIS can organise a city’s geography, display assessment results and expose gaps in the underlying data. The most useful finding from these maps is probably the third one, that a facility list which looks complete can leave out large parts of a city. That is exactly why the guideline asks cities to get the map right first, and why it says vulnerability mapping “is not to be seen as one time activity”.
Sources and methods
- Ministry of Health and Family Welfare, National Urban Health Mission. Guidelines and Tools for Vulnerability Mapping & Assessment for Urban Health. 2017.
- UN-Habitat. Definition of slum households (the five household deprivations).
- Ward boundaries and facility locations compiled from publicly available sources (April 2026).
- Roads and base map from OpenStreetMap contributors, licensed under the Open Database License (road data snapshot of 9 October 2026).
- Map 2 blocks were made by turning the road network into polygons, removing slivers under 0.2 ha, long thin strips and areas over 100 ha, and assigning each remaining block one of four categories at random (seed 2017, with probabilities of 55%, 20%, 15% and 10%).
- Map 3 distances are straight-line distances from the centre of each 100 metre square to the nearest listed facility.
Views are my own.