Key points
- India's Health Management Information System (HMIS) recorded 21.4 million deliveries, 1.67 billion outpatient visits and 903 million laboratory tests in 2019-20, from 6,717 reporting units in 704 districts.
- The data shows patterns worth investigating, such as monthly variation in dengue, malaria and childhood diarrhoea, caesarean rates that differ several-fold between public and private facilities, and 62 female sterilisations for every vasectomy.
- It also shows where the data has important limitations. Almost half of adult deaths are recorded with no known cause, 47 of the 285 data items were filled in fewer than 5% of reports, and private-sector reporting is uneven across services. These are questions of design and process as well as data, and digital tools may help with some of them.
Every month, public health facilities in India, and participating private ones, report through the Health Management Information System (HMIS). The reports cover how many pregnant women registered, how many babies were born and vaccinated, how many people came to the outpatient clinic, how many tests were done, and how many people died and of what. The numbers flow up from facility to block to district to state. It is a large national routine health information system.
Having worked with HMIS data, I wanted to see what a full year of it looks like when you put it all in one place and ask it questions. Not only about mothers and babies, but about the whole service, and about the system that produces the numbers. The figures here are what was reported through HMIS, not a complete measure of how India’s health system performs, and the aim is not to blame the people who produce the data. It is to understand how definitions, workflows, identifiers and system design shape the information available for decisions.
Building the dataset, and two traps
HMIS publishes item-wise reports for every district and month on its official portal, where anyone can access them. I used all 8,447 of these publicly accessible reports for April 2019 to March 2020 (one district, Nawanshahr in Punjab, has no April file), loaded them into a single PostgreSQL database, and wrote every number in this article as a SQL query on that one table, so that each figure has one defined calculation.
Two traps are worth describing, because they are the kind any analyst, or any AI tool, would fall into.
District totals hidden as units. Each district file lists its blocks side by side, plus one column that looks like another unit. It is actually the district total, and in every one of 2.4 million item-by-month comparisons it equals the sum of the blocks. Add everything up naively and every number doubles, giving 42 million live births instead of 21 million.
Units with the same name. Many districts have a reporting unit called “District HQ”, “DHQ” or “Notional Private Facilities”. Across India, 86 such names are shared by 463 reporting units. A preliminary version of my own dataset, built before I went back to the original files, had merged units that shared a name within a state. It looked complete and was internally consistent. When I validated it against the original files, it was short by 15% of institutional deliveries and 23% of caesarean sections, so I rebuilt it from the files, and every figure here comes from the rebuilt version.
There is also a lesson about architecture. HMIS reporting units are identified by name, and a name is not an identifier. Stable codes for facilities and administrative units, such as India’s Local Government Directory codes or the Health Facility Registry under the Ayushman Bharat Digital Mission, supported by maintained reference data and clear mapping rules, can greatly reduce errors caused by ambiguous names.
What the data says about health services
Births. Of 21.4 million reported deliveries, 94.5% happened in a health facility, and almost a third of facility births were in private facilities.
The reported caesarean rate was 14% in public facilities and 34% in private ones, with large differences between states. In Bihar, 2% of public facility births were reported as caesareans. In private facilities in West Bengal and Jammu and Kashmir, the reported rates were 80% and 89%. These differences deserve a closer look, but aggregate HMIS data cannot show whether individual procedures were appropriate or whether women received the care they needed. That would need information on obstetric risk, referral patterns, facility capability and reporting completeness. WHO’s 2015 statement found that, at population level, rates above about 10% are not associated with lower maternal and newborn mortality, and WHO cautions against using that figure as a target for individual facilities.
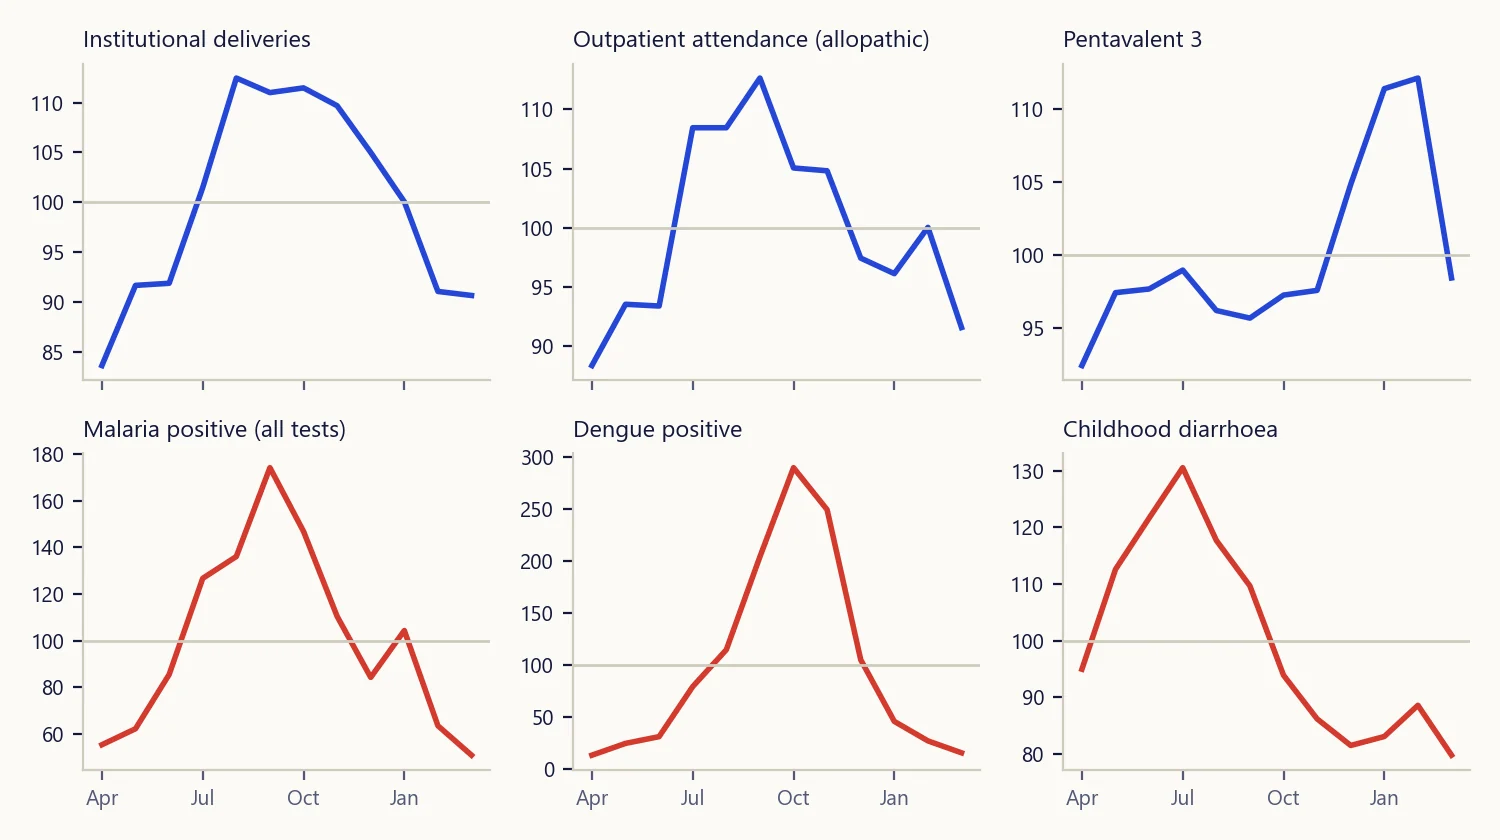
Seasons. Monthly totals illustrate how reported services and diseases varied through the year. One year cannot establish a recurring pattern, but the shape is familiar. Dengue cases peaked in October at nearly three times their monthly average, and malaria in September at 1.7 times. Childhood diarrhoea peaked in July, with the monsoon, and childhood pneumonia in December. Deliveries rose from August to October, a seasonality of births seen in many countries. Pentavalent vaccinations rose in January and February, at the same time as the intensified immunisation rounds of that winter. In March 2020, outpatient visits and deliveries were about 8-9% below the year’s monthly average. The first COVID-19 lockdown began only in the last week of that month, so this simple comparison does not isolate its effect.
Family planning. Facilities reported 3.4 million female sterilisations and 54,815 vasectomies, a ratio of 62 to 1. Spacing methods were substantial too, with 5.8 million IUCD insertions. In the reported figures, permanent contraception in the public programme falls almost entirely on women.
Beyond maternal health. Outpatient clinics recorded 34 million visits for diabetes, 40 million for hypertension and 6 million for mental illness. Emergency departments registered 60 million patients, including 4.9 million for trauma (accidents, injuries and poisoning, 8% of all emergency registrations), 259,000 for snakebite and 144,000 for burns. Malaria test positivity was highest in Mizoram (4.6%) and Chhattisgarh (2.7%).
What the data says about the data
The same table that shows health services also shows how well the system records them.
Reporting is complete, recording is uneven. Almost no unit was silent. In a typical month, one or two of 6,717 units reported nothing at all. But completeness of reporting is not completeness of information.
Many causes of death are unknown. Of 2.3 million adolescent and adult deaths reported, 49% were recorded as “causes not known”. For maternal deaths, 69% fell under “other causes, including causes not known”. A death count without a cause tells a programme that something happened, but not what to do about it.
Mortality reporting differs across sources. HMIS recorded 19,283 maternal deaths against 21.2 million recorded live births, about 91 per 100,000. The Sample Registration System (SRS), India’s official population-based source, estimated the maternal mortality ratio at 103 for 2017-19. For infants, HMIS recorded about 11 infant deaths per 1,000 recorded live births, against an SRS infant mortality rate of 30 in 2019. These figures are not directly comparable, because they differ in period, coverage and method, so the gap is not a direct count of missed deaths. A likely part of it is deaths at home or in the community, which a facility-based system may not see. The comparison shows why HMIS mortality figures are best read alongside independent population estimates. (Deliveries and live births are different counts, which is why the two figures above differ slightly.)
More vaccinations than births. HMIS recorded 113 BCG doses and 120 first measles-rubella doses for every 100 live births it recorded. Doses given and births recorded are different measures, and the likeliest explanation is an incomplete count of births. Births outside the reporting system, in private hospitals that do not report and among migrant families, are vaccinated in public facilities but never counted as births. Coverage calculated from HMIS alone can exceed 100% for this reason.
Private reporting varies by service. Private facilities accounted for 32% of reported facility births and 53% of caesareans, but only 5% of outpatient visits and 6% of laboratory tests. Private reporting to HMIS appears strongest around births, where programmes have focused, and thinner elsewhere.
Parts larger than their whole. Some items are subsets of others. Babies weighed cannot exceed babies born, and positive tests cannot exceed tests done. I ran 18 such checks on every unit and month where the items were reported, 1.03 million comparisons in all. Only 1.1% failed, but 3,344 of the 6,713 units with data for these checks failed at least once during the year. So failures were uncommon in any single comparison but spread across many units. These checks flag values for review. They do not measure the overall accuracy of the system, and not every flagged value is wrong. The most common failures were newborns weighed exceeding live births (5% of unit-months) and hypertension cases managed exceeding those detected (3%).
The form itself. Of 285 data items, 47 had a number above zero in fewer than 5% of all reports, and 23 in fewer than 1%. Some of these are rare events that should be rare, such as deaths after sterilisation, and some apply only to certain facilities. Low use is a starting point for reviewing the form, not proof that an item is unnecessary. Any change would need to weigh each item’s clinical and programme importance against the time it takes to report.
The system is a business process
It is tempting to treat these as data-cleaning problems. Many of them probably reflect a mix of process, reporting and system design. A monthly aggregate form is compiled by a facility nurse or data operator from registers, often at the end of a long day, entered at block level, and reviewed by staff who also have programme duties. In my interpretation, each finding points to a possible improvement, none of which this analysis has tested.
- Validation at entry. The 18 consistency checks here are simple rules. Strengthening checks like these at the point of entry, with a prompt to correct or explain, may be relatively low-cost to pilot and can catch errors while the person who knows the answer is still at the desk.
- A reviewed form. Reviewing rarely used items could give staff time back for the items that matter most, such as the cause of death.
- Identifiers, not names. Linking every reporting unit to a registry code, with maintained reference data, would reduce the merging and double counting that can silently distort totals.
- Counting what happens outside the facility. Deaths and births in the community are where HMIS is weakest. Civil registration and community health worker reporting are the routes to closing that gap, and linking them is a digital health task.
Where AI and predictive models fit
Finding unusual values. I ran a simple, transparent anomaly detector on 23 headline items. For each unit and item, it compares every month with that unit’s own median and flags values that are unusually high. A value is flagged only if it is more than ten times the median absolute deviation above the median, more than three times the median, and at least 50 above it. It looks only for unusually high values. It flagged 10,869 of 1.8 million values, in 3,598 units. Some flags are real events, such as a camp or a new service. Others look like recording errors. One block reported exactly the same outpatient figure, 5,611, in four different months, and zero in most others, and several blocks with a usual monthly caesarean count of zero reported hundreds in a single month. A flag is not a finding. It is a prompt for a district data manager to make a phone call. A light monthly review of flags like these, with people deciding which are errors and which are real changes, could be worth piloting.
Forecasting for supplies and staff. The monthly variation in dengue, malaria and diarrhoea is visible even in one year of data. With several years of consistent data, forecasting monthly caseloads by district, to pre-position test kits, ORS and zinc or to plan staff leave, could be explored, tested against past years and simple baselines before being used for decisions.
What these data cannot do. HMIS is aggregate and monthly. It has no individual patients, so it cannot predict which woman is at risk or which child will drop out of immunisation. Models like that would need suitable individual-level data, a lawful basis for using it, privacy safeguards and careful validation. Models trained on HMIS also inherit its gaps. An outbreak model will not see deaths that were never recorded.
Language models on top of the data. An obvious idea is a chatbot that answers a district officer’s question, “How did my district do on full immunisation this quarter?”, in plain language. It can work, if the numbers come from a query like the ones in this article and the model only writes the sentence around them. Language models are not reliable sources of numbers on their own. In a separate benchmark run, an open medical model changed many of its answers when only the order of the options changed. Statistics should come from the data, with the model grounded in it and its output checked.
Limits
- One year. April 2019 to March 2020. Monthly patterns should be checked across years before being read as seasonal.
- What HMIS records is not what happens. All figures are as reported. Coverage, death and private-sector figures are particularly affected by under-recording.
- Checks find inconsistencies, not truth. A value can pass every check and still be wrong.
- District totals as published. I used blocks, and the district totals in the files matched them exactly.
- Missing file. Nawanshahr (Punjab) has no April 2019 file.
Sources
- Ministry of Health and Family Welfare. Health Management Information System, item-wise monthly reports by district, 2019-20 (HMIS portal).
- Ministry of Health and Family Welfare, Press Information Bureau releases on the Sample Registration System: maternal mortality ratio 103 for 2017-19 (Special Bulletin on Maternal Mortality, Registrar General of India) and infant mortality rate 30 for 2019 (SRS Bulletin).
- World Health Organization. WHO statement on caesarean section rates. 2015.
- Ministry of Panchayati Raj. Local Government Directory. National Health Authority. Health Facility Registry, Ayushman Bharat Digital Mission.
SQL views and code available on request.
Views are my own.